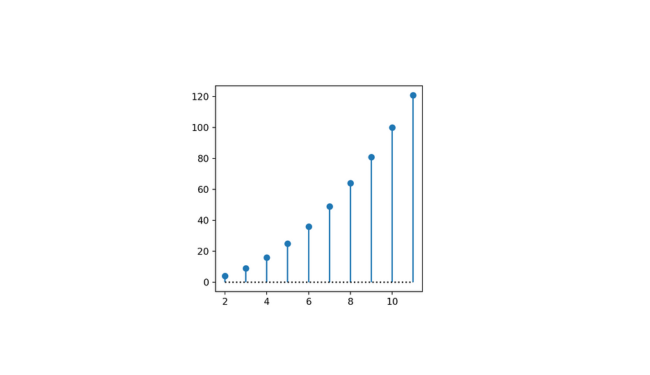
Hey there, Pythonista! Ever found yourself squinting at a plot because it’s too small? Or struggling to fit a massive plot into your report? Well, you’re in right place!
Here, in this article, we will explain how to change the plot size in Matplotlib using different methods. This will help you create clear, beautiful, and perfectly sized plots for any purpose. Let’s get started!
Why Change the Plot Size?
Before we know how, let’s discuss few common reasons why you need to change the plot size.
- Clarity: Larger plots can make complex data easier to understand.
- Aesthetics: Properly sized plots just look better.
- Layout: You might need to fit your plot into specific spaces in documents or presentations.
Changing the plot size can greatly improve your data visualization. So, let’s explore the various ways to do it.
How to Change Plot Size in Python with plt.figsize()
1. Using the ‘figsize‘ Attribute
The most easy way to change the plot size is by using the ‘figsize‘ attribute in the ‘plt.figure()‘ function. The ‘figsize‘ attribute takes a tuple representing the width and height in inches.
Here’s a simple example:
import matplotlib.pyplot as plt

# Set the figure size
plt.figure(figsize=(10, 5))

# Create a simple plot
plt.plot([1, 2, 3, 4], [10, 20, 25, 30])
plt.title('Basic Plot with Custom Size')
plt.show()
This code sets the figure size to 10 inches wide and 5 inches tall.
When to Use ‘figsize‘
- Detailed Visualizations: If you have a plot with a lot of data points or detailed information, increasing the figure size can improve readability.
- Multi-Plot Layouts: When creating subplots, you might need more space to avoid clutter.
Example using ‘figsize‘
import numpy as np

# Create data
x = np.linspace(0, 10, 100)
y = np.sin(x)

# Set larger figure size for better clarity
plt.figure(figsize=(12, 6))
plt.plot(x, y)
plt.title('Sine Wave with Larger Figure Size')
plt.show()
A larger figure size helps display the sine wave more clearly.
2. Using ‘set_figwidth()‘ and ‘set_figheight()‘
Sometimes, you may want to adjust the width and height of an existing figure. Matplotlib provides ‘set_figwidth()' and ‘set_figheight()‘ methods for this purpose.
Using ‘set_figwidth()‘
fig = plt.figure()
ax = fig.add_subplot(111)
ax.plot([1, 2, 3, 4], [10, 20, 25, 30])

# Change the figure width
fig.set_figwidth(12)
plt.title('Plot with Custom Width')
plt.show()
This method sets the width of the plot to 12 inches.
Using ‘set_figheight()‘
fig = plt.figure()
ax = fig.add_subplot(111)
ax.plot([1, 2, 3, 4], [10, 20, 25, 30])

# Change the figure height
fig.set_figheight(8)
plt.title('Plot with Custom Height')
plt.show()
This method sets the height of the plot to 8 inches.
Combining ‘set_figwidth()‘ and ‘set_figheight()‘
You can also combine these methods to set both dimensions.
fig = plt.figure()
ax = fig.add_subplot(111)
ax.plot([1, 2, 3, 4], [10, 20, 25, 30])

# Change both the width and height
fig.set_figwidth(12)
fig.set_figheight(8)
plt.title('Plot with Custom Width and Height')
plt.show()
3. Using ‘rcParams‘ to Set Default Figure Size
If you often find yourself needing to change the figure size, you can set a default size for all plots using ‘rcParams‘.
import matplotlib as mpl

# Set the default figure size
mpl.rcParams['figure.figsize'] = [10, 5]

# Now all plots will use this size by default
plt.plot([1, 2, 3, 4], [10, 20, 25, 30])
plt.title('Plot with Default Custom Size')
plt.show()
This approach is useful for maintaining consistency across multiple plots in a project.
Adjusting Size for Different Output Formats
Sometimes, you need to adjust the plot size depending on the output format, such as saving the plot as an image or displaying it in a notebook.
Saving Plots as Images
When saving a plot, you can specify the size to ensure it looks good in your documents.
# Create a plot
plt.figure(figsize=(8, 4))
plt.plot([1, 2, 3, 4], [10, 20, 25, 30])
plt.title('Plot to be Saved as Image')

# Save the plot with the specified size
plt.savefig('plot.png')
plt.show()
Displaying Plots in Jupyter Notebooks
If you’re working in a Jupyter notebook, adjusting the plot size can improve the display within the notebook interface.
# Adjusting plot size in Jupyter Notebook
plt.figure(figsize=(14, 7))
plt.plot([1, 2, 3, 4], [10, 20, 25, 30])
plt.title('Plot in Jupyter Notebook')
plt.show()
The larger size makes it easier to view and interact with the plot directly in the notebook.
Practical Tips and Tricks
Here are a few tips to make the most out of changing plot sizes:
- Experiment with Sizes: Don’t be afraid to try different sizes. What works for one plot might not work for another.
- Use
tight_layout(): This function adjusts the padding between and around subplots, helping to prevent overlapping labels and titles. - Combine with Other Customizations: Adjusting figure size works well with other customizations like font size and line width to enhance readability.
Example: Combining Size with Other Customizations
# Create data
x = np.linspace(0, 10, 100)
y = np.sin(x)

# Set figure size and customize plot
plt.figure(figsize=(10, 5))
plt.plot(x, y, linewidth=2.0)
plt.title('Customized Sine Wave Plot', fontsize=14)
plt.xlabel('X-axis', fontsize=12)
plt.ylabel('Y-axis', fontsize=12)
plt.grid(True)
plt.show()
Combining figure size adjustment with other customizations results in a clear and professional-looking plot.
Wrapping Up
Changing the plot size in Matplotlib using ‘plt.figsize()‘, ‘set_figwidth()‘, ‘set_figheight()‘, and ‘rcParams‘ is a simple and powerful way to improve your data visualizations.
Whether you’re presenting detailed data, creating multi-plot layouts, or preparing images for reports, adjusting the figure size can make a significant difference.
Remember, you can set the figure size directly in the ‘figure()‘ function, use ‘rcParams‘ for global settings, and adjust sizes dynamically depending on the output format. Experiment with different sizes and settings to find what works best for your specific needs.
Got any questions or tips of your own? Drop them in the comments.
Also Read:
